The sound surveillance system (SOSUS) provides deep-water long-range detection capability. SOSUS enjoyed tremendous success during the Cold War tracking submarines by their faint acoustic signals. It consists of high-gain long fixed arrays in the deep ocean basins. BEAM accesses form beams from multiple hydrophone arrays trained on the seafloor to provide signal gain obtained through beam forming. PHONE accesses individual hydrophones from arrays throughout the oceans providing omni-directional coverage.
This project focuses on automatic identification of acoustic signals. The first step of which is the separation of the "interesting" acoustic signal from ambient noise and from other signatures of interest.
The Problem
| The basic problem is to "unmix" an observed signal without having any prior knowledge about the original signals, hence the term "blind source separation". We assume that the original signals are statistically independent from each other (this is a valid assumption when signals are generated by distinct physical objects in space). And we also assume that our original signals have a non-Gaussian distribution; All relevant information for Gaussian distributed signals can be found in a covariance matrix, so the higher-order statistics of the ICA model would not be necessary. Furthermore, no physical underwater events have a Gaussian acoustic signature, so we don't need to deal with this case. | ||
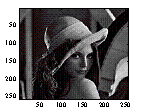 Source 1 (s1) |
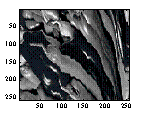 Source 2 (s2) |
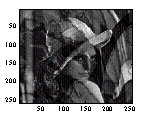 Observed (x) x1(t) = a1s1(t) + a2s2(t) |
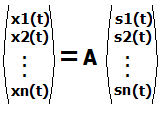 |
Find A (the mixing matrix consisting of ai) and (independent source signals si) given only x. | |
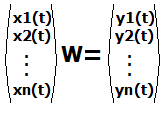 |
In other words, find a transformation (given by matrix W) so that the variables y are as independent as possible. | |
The Solution
Preliminary Processing (Principal Component Analysis)
Firstly, we "whiten" the data by applying the PCA technique. This provides two important pre-processing functions: (1) It reduces the data set which makes the problem computationally simpler; and (2) It decorrelates the input data which makes it easier to detect independent components (since decorrelation is necessary but not sufficient condition for statistical independence).
| Data Reduction | ||
 |
 Cx = cov(x); imagesc(Cx); |
 [E,D] = eig(Cx); plot(diag(D),'.'); |
| We saw (in the plot on the right) that many of the eigenvectors are zero, and thus can be used to reduce our data set (if we decompose our input signal on the eigenvectors. | ||
| Data Decorrelation | ||
 |
 |
 |
| We see that the observed (mixed) signals are heavily correlated (they mixtures from different hydrophones are actually recording the same things so it makes sense that this is the case). This makes it harder to separate the original signals from the mixture. We saw (in the plot on the right) that decomposition onto eigenvectors has the effect of spreading out the points (or decorrelating the mixture). | ||
| Result | ||
 |
Our transformed mixture is simply our mixture (the original x) projected onto the eigenvectors of the covariance matrix. The resulting mixture is reduced and decorrelated and simpler to apply Independent Component Analysis on. | |
Preliminary Work
We chose non-gaussianity as our criteria for independence. This is a standard metric since by the Central Limit Theorem a linear combination a1s1 + a2s2 (i.e. x) is more gaussian than the original signal s.
Since a Gaussian variable has maximal entropy, we can analyze non-Gaussianity of our observed signal by measuring the difference between its entropy and Gaussian entropy. Therefore, our measure of nongaussianity (J(y)) is given by: J(y) = H(ygauss) – H(y), where H(Y) = ∑ P(Y) log P(Y) (Hyvärinen)
Therefore by maximizing the non-Gaussianity of Wx, we can recover a signal s1. Maximizing non-Gaussianity amounts to a well-known problem (i.e. maximizing a function F with respect to W).
Results
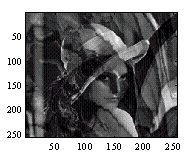 Observed |
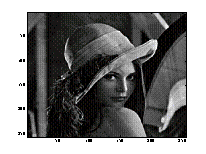 Restored Image (s1) |
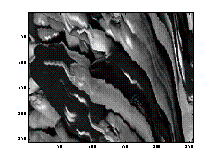 Restored Image (s2) |
Ongoing Work
- Independence Criteria: We will look at other criteria for measuring independence including non-linear decorrelation, maximum likelihood estimation, and other measures of non-gaussianity including Bingham, Ella Hyvarinen, and Aapo's work on negentropy.
- Maximization Techniques: During our preliminary work we used a straight-forward simplex method (Matlab's fminsearch). There are many maximization techniques which will converge faster including some fixed-point iteration algorithms.
- Assembly Programming: The software has strict timing requirements so it must be optimized to operate in this environment.

